Careful Scientist Choice and Timing Analysis
Posted on June 16th, 2013
In an effort to make visible the choices that each performer makes in performing the Careful Scientist exercise, we devised a motion capture analysis algorithm to track data captured in different performers execution of the Careful Scientist. OSU graduate research assistant J. Eisenmann designed the algorithm which is run on the motion capture files and identifies which action is happening on which arm and over what amount of time (in frames).
An example of the data list that the algorithm generates from one of Thomas Hauert’s motion captured performances of the exercise:
Who Frame, Action, L/R side
————————————
Thomas,1591,3_ElbowFlex,L,
Thomas,1645,1_UpperArmPointing,R,
Thomas,1877,4_ForearmRotation,L,
Thomas,2086,3_ElbowFlex,R,
Thomas,2262,1_UpperArmPointing,L,
Thomas,2470,2_ShoulderRotation,R,
Thomas,2766,4_ForearmRotation,L,
Thomas,2955,3_ElbowFlex,R,
Thomas,3154,1_UpperArmPointing,L,
Thomas,3478,4_ForearmRotation,L,
Thomas,3533,1_UpperArmPointing,R,
Thomas,3751,3_ElbowFlex,L,
Thomas,4007,3_ElbowFlex,R,
Thomas,4190,4_ForearmRotation,L,
After the algorithm generates the data list, we then review the motion capture file frame by frame and compare what we observe to the data list. The algorithm makes correct identification of an action about 75% of the time and about 25% of the data list needs to be corrected through direct observation. It is most difficult for the algorithm to differentiate between the actions we call Upper Arm Pointing and Shoulder Rotation due to the way in which values for those movements are recorded by our motion capture software.
With this data list we then visualize this data to map choices that each performer is making as well as comparing choices and timing across dancers.
In the following three preliminary choice diagrams we can see the left and right arm choices that each performer is making. In these diagrams choice is the focus, and time is not mapped except to demonstrate the number of choices made over an arbitrary length of time.
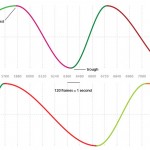
An important (and difficult) part of the Careful Scientist exercise is the required variation in timing that takes place on each side of the body. To map these timing choices for each performer we create a wave diagram that represents the timing of each action.

The midpoint of the crest and trough of each wave represents the start of a new action, which is also designated by a color change.
In these preliminary timing diagrams left and right timings are stacked and aligned along a timeline that is marked with increments of 120 frames (or 1 second).
Here we compare Thomas’s timings to those of Sara Ludi’s. These visualizations begin to reveal differing approaches to timing choices in the exercise within a specific performance of Careful Scientist. It is important to remember that this data reveals information on only one particular performance of the exercise by each dancer.
These data and diagrams led us to start asking about the number of permutations possible in the Careful Scientist rule structure.
-Maria
Tagged: bi-manual, Careful Scientist, Choice, data, Improvisation


